

Available on the Enterprise plan. Contact sales to learn more.
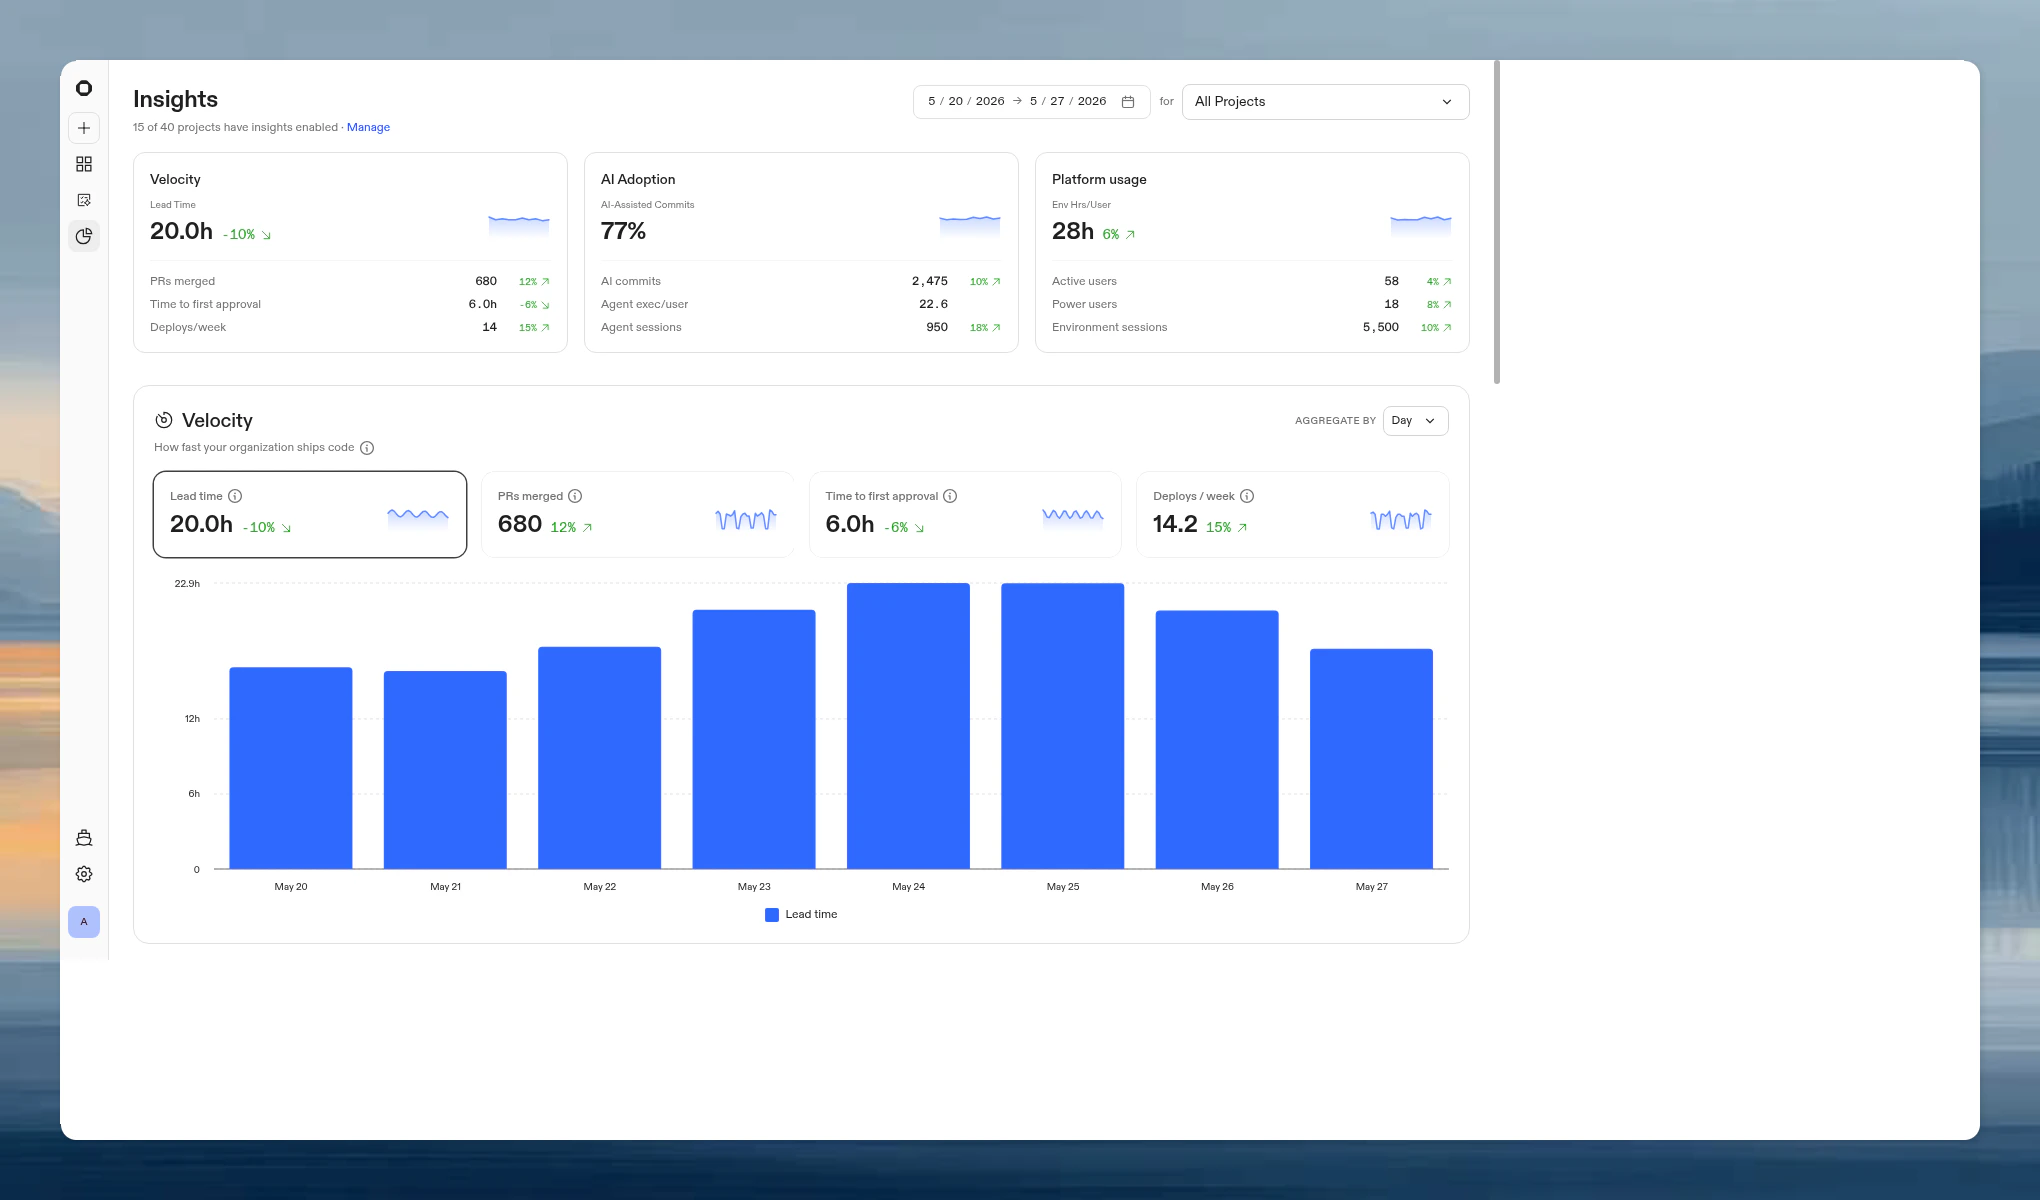
- Velocity. How fast your organization ships code.
- AI Adoption. How your organization leverages AI to ship code.
- Platform usage. How your organization uses Ona environments.
Enabling insights
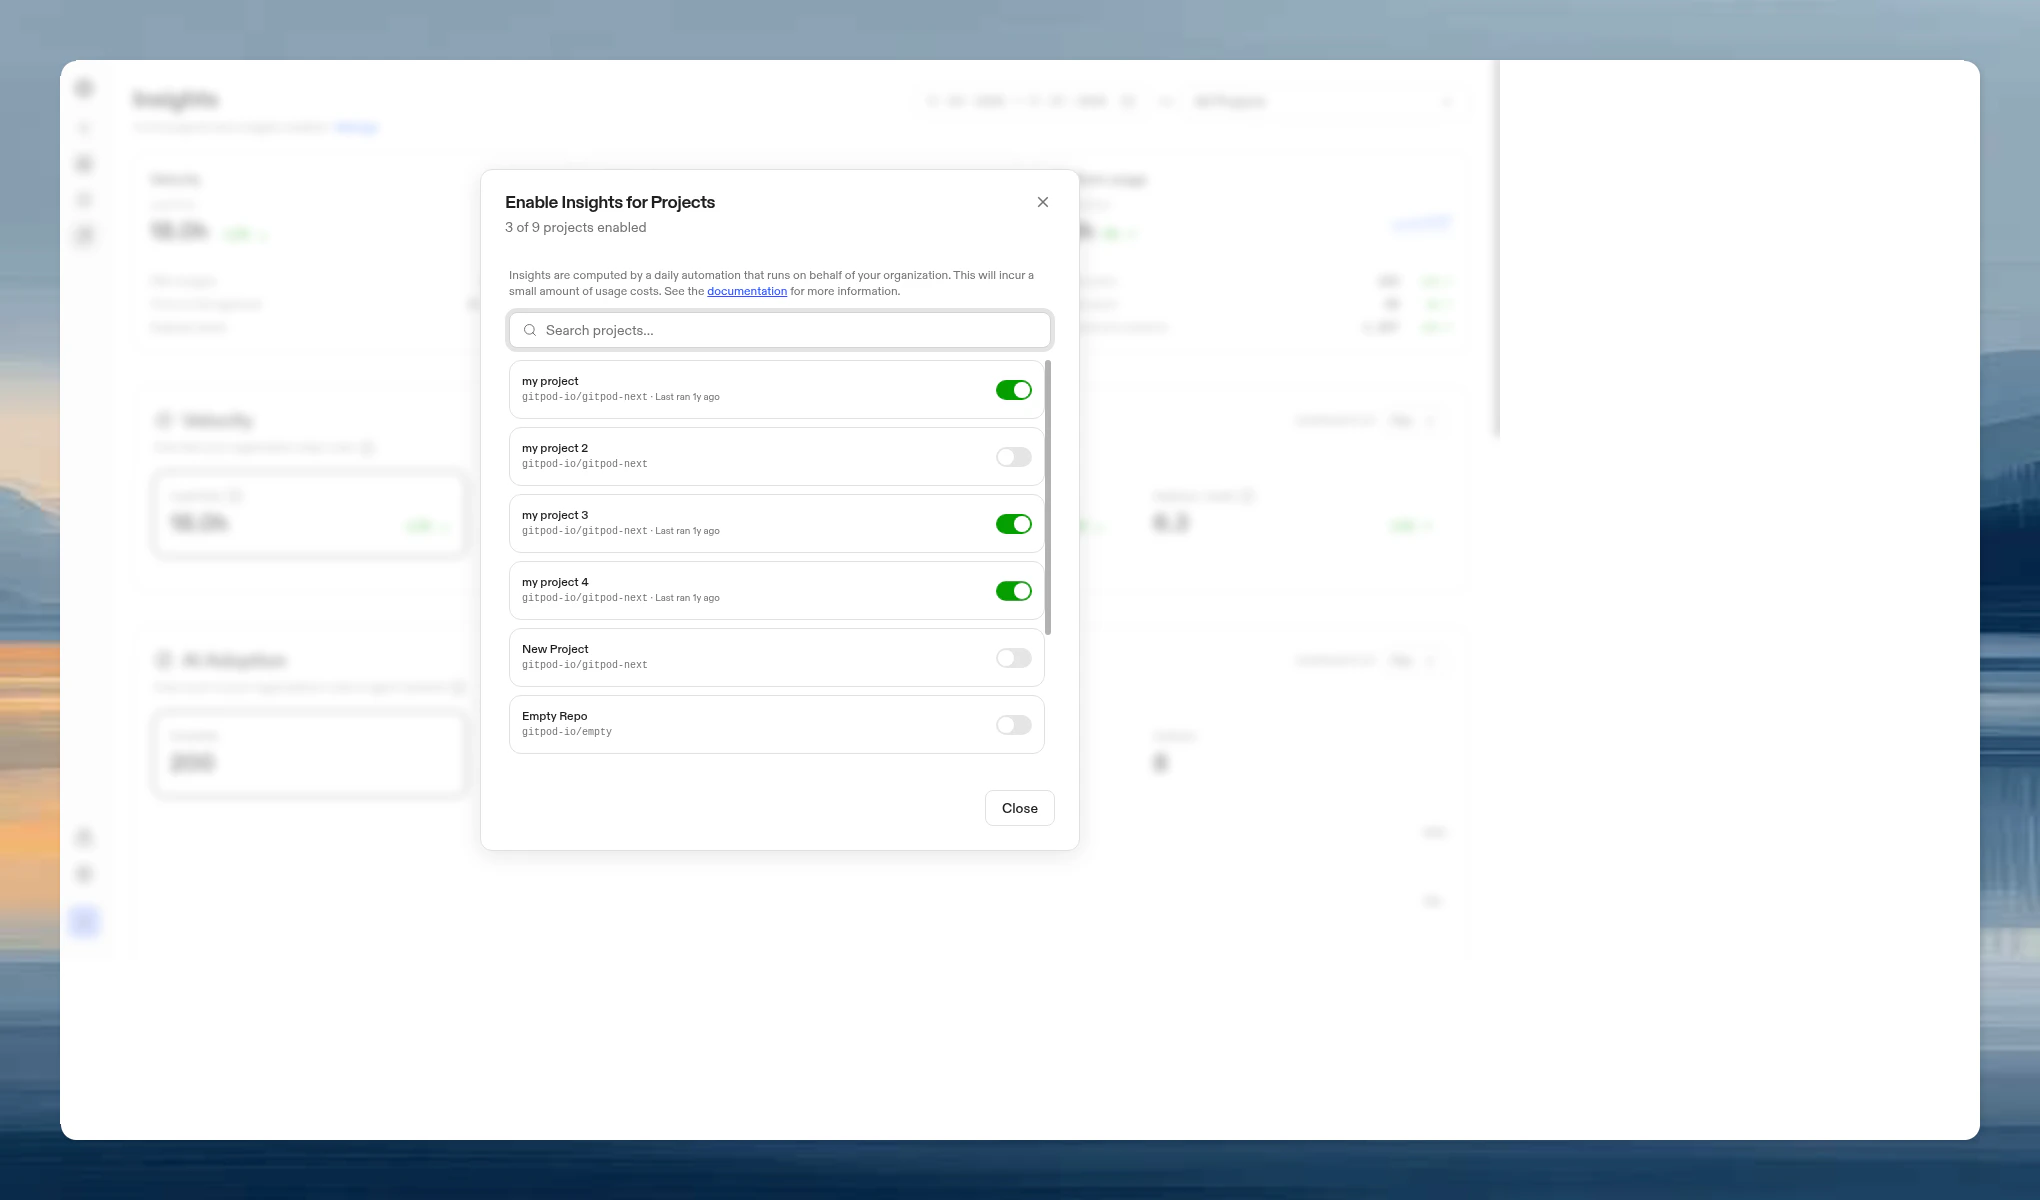
Velocity and AI Adoption require per-project enablement. Platform usage data is collected automatically for all projects. To enable insights for a project:- Go to Insights and click Manage in the page header.
- Toggle on the projects you want to track.
Filters
All three sections share a set of filters at the top of the page:- Date range. Pick a preset (Last 7 days, Last 14 days, Last 30 days, Last 90 days, Last 6 months, Last year) or enter a custom range. The maximum range is one year.
- Project. Scope all metrics to a single project, or view across all projects.
- Team. Scope all metrics to a specific team.
Summary cards
At the top of the page, three summary cards provide an at-a-glance overview:
Each card includes a sparkline and trend indicator comparing the selected period to the previous period of equal length. Click a card to scroll to its section.
Velocity
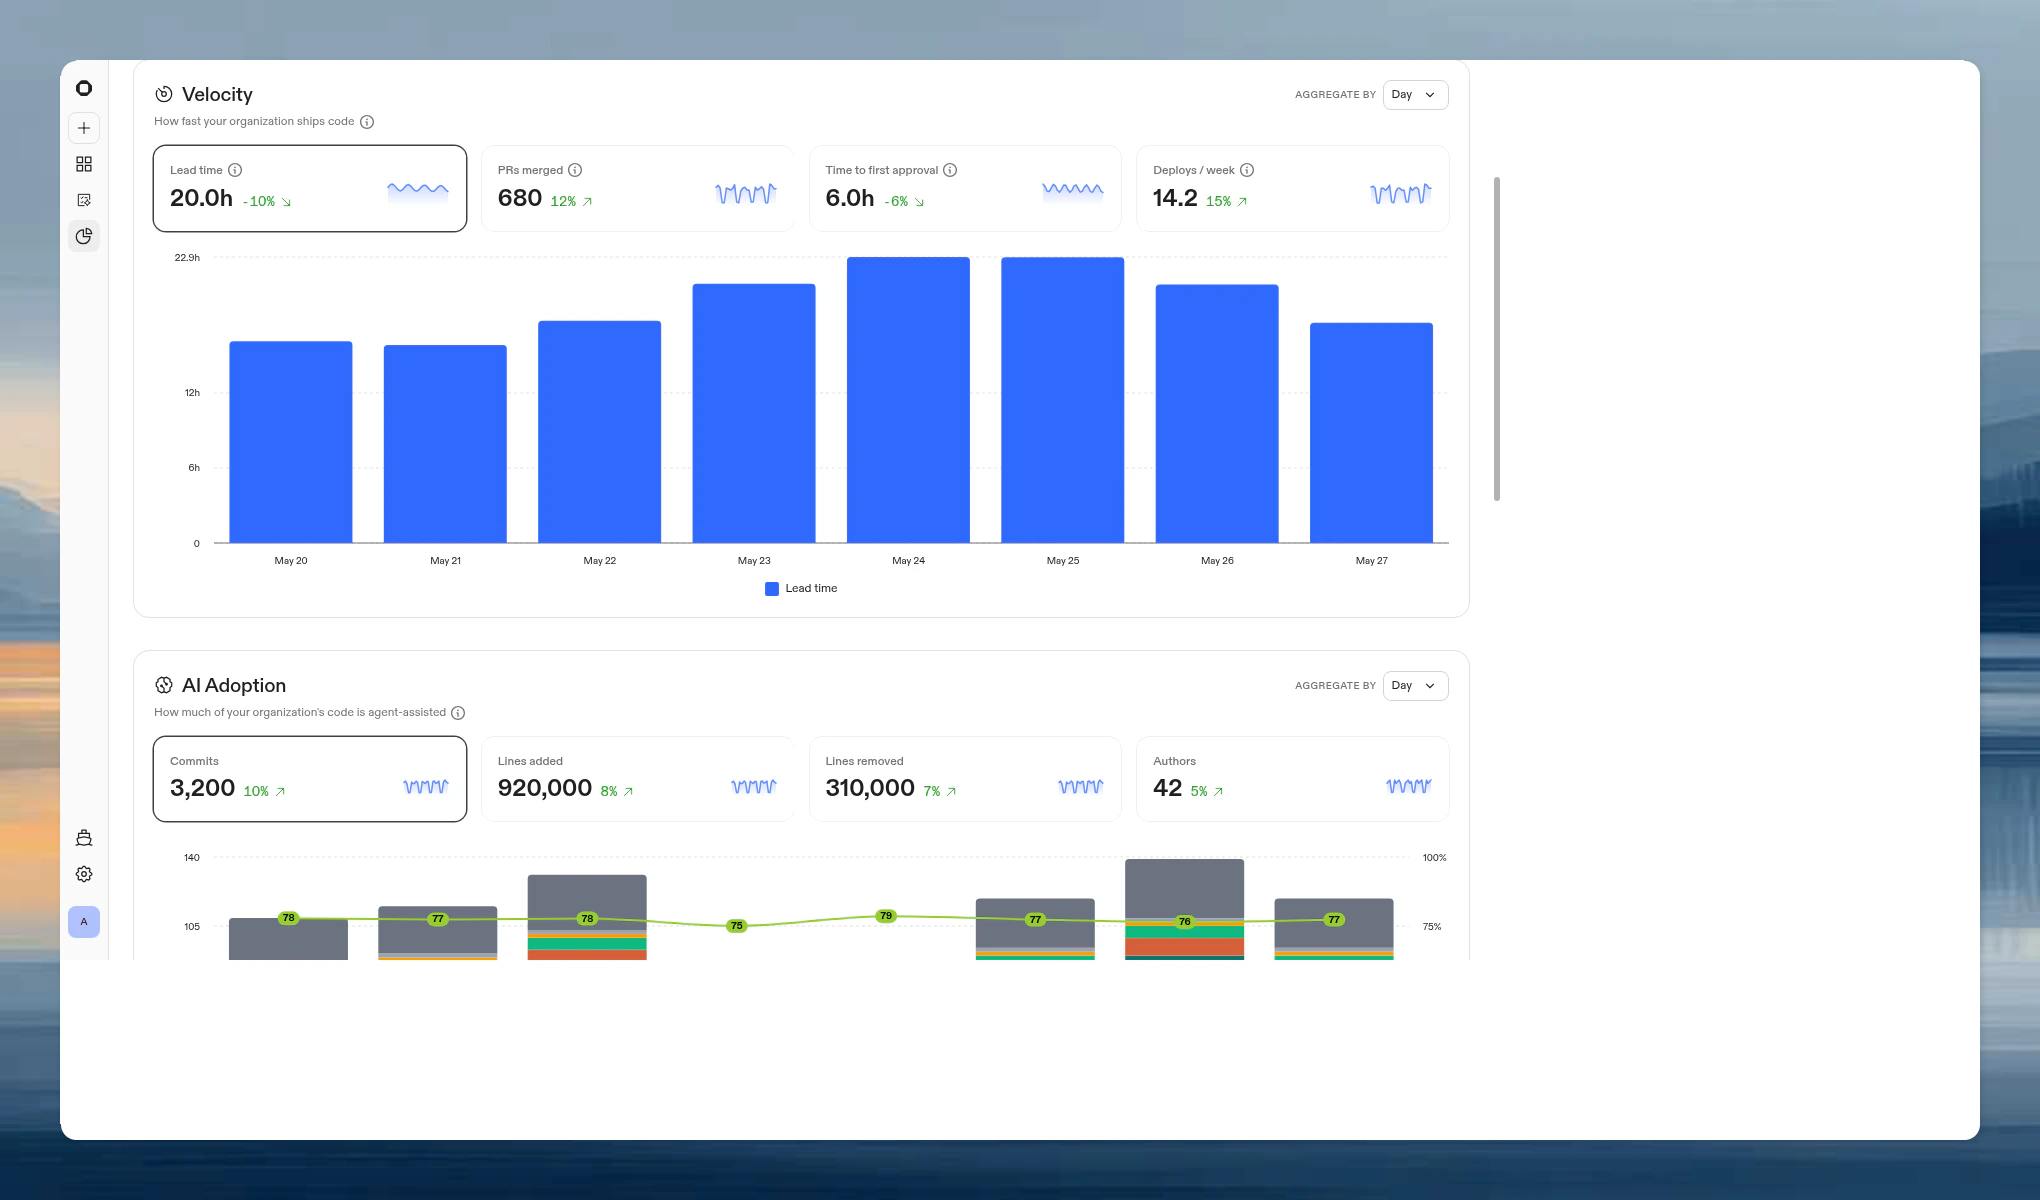
Click a metric card to view its time-series chart. Use the Aggregate by toggle to switch between daily and weekly buckets.
For lead time and time to first approval, a downward trend is positive (faster shipping). For PRs merged and deploys/week, an upward trend is positive.
AI Adoption
Metric cards
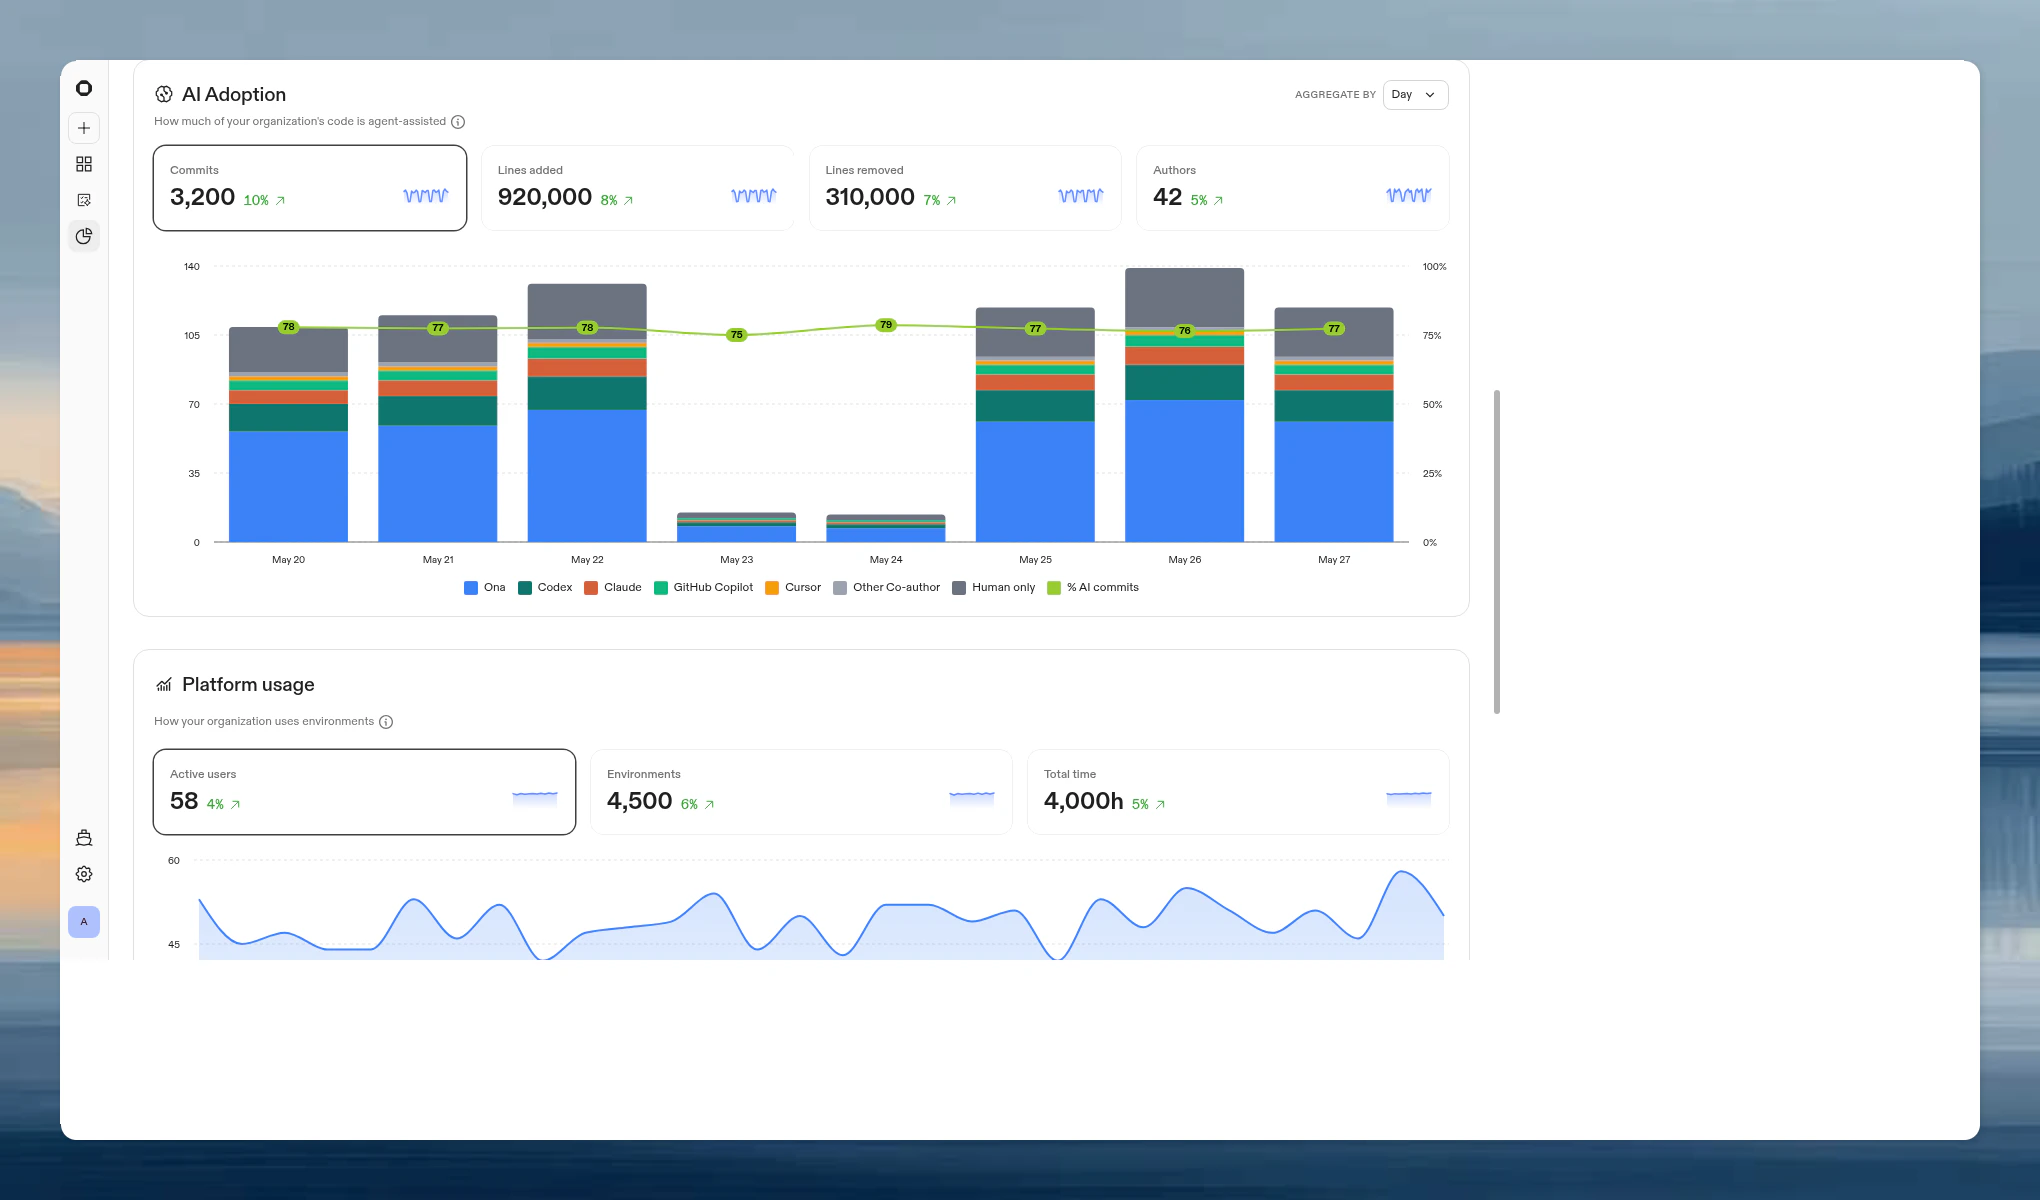
Click a metric card to view its time-series chart.
Breakdown modes
For the Lines added and Lines removed views, a toggle switches between two attribution methods:- By co-author. Attributes lines based on
Co-authored-bygit trailers. Breaks down into: Ona, Codex, Claude, GitHub Copilot, Cursor, Other AI, Other Co-author, and Human only. - By agent output. Attributes lines based on AI authorship metadata tracked at the session level.
Platform usage
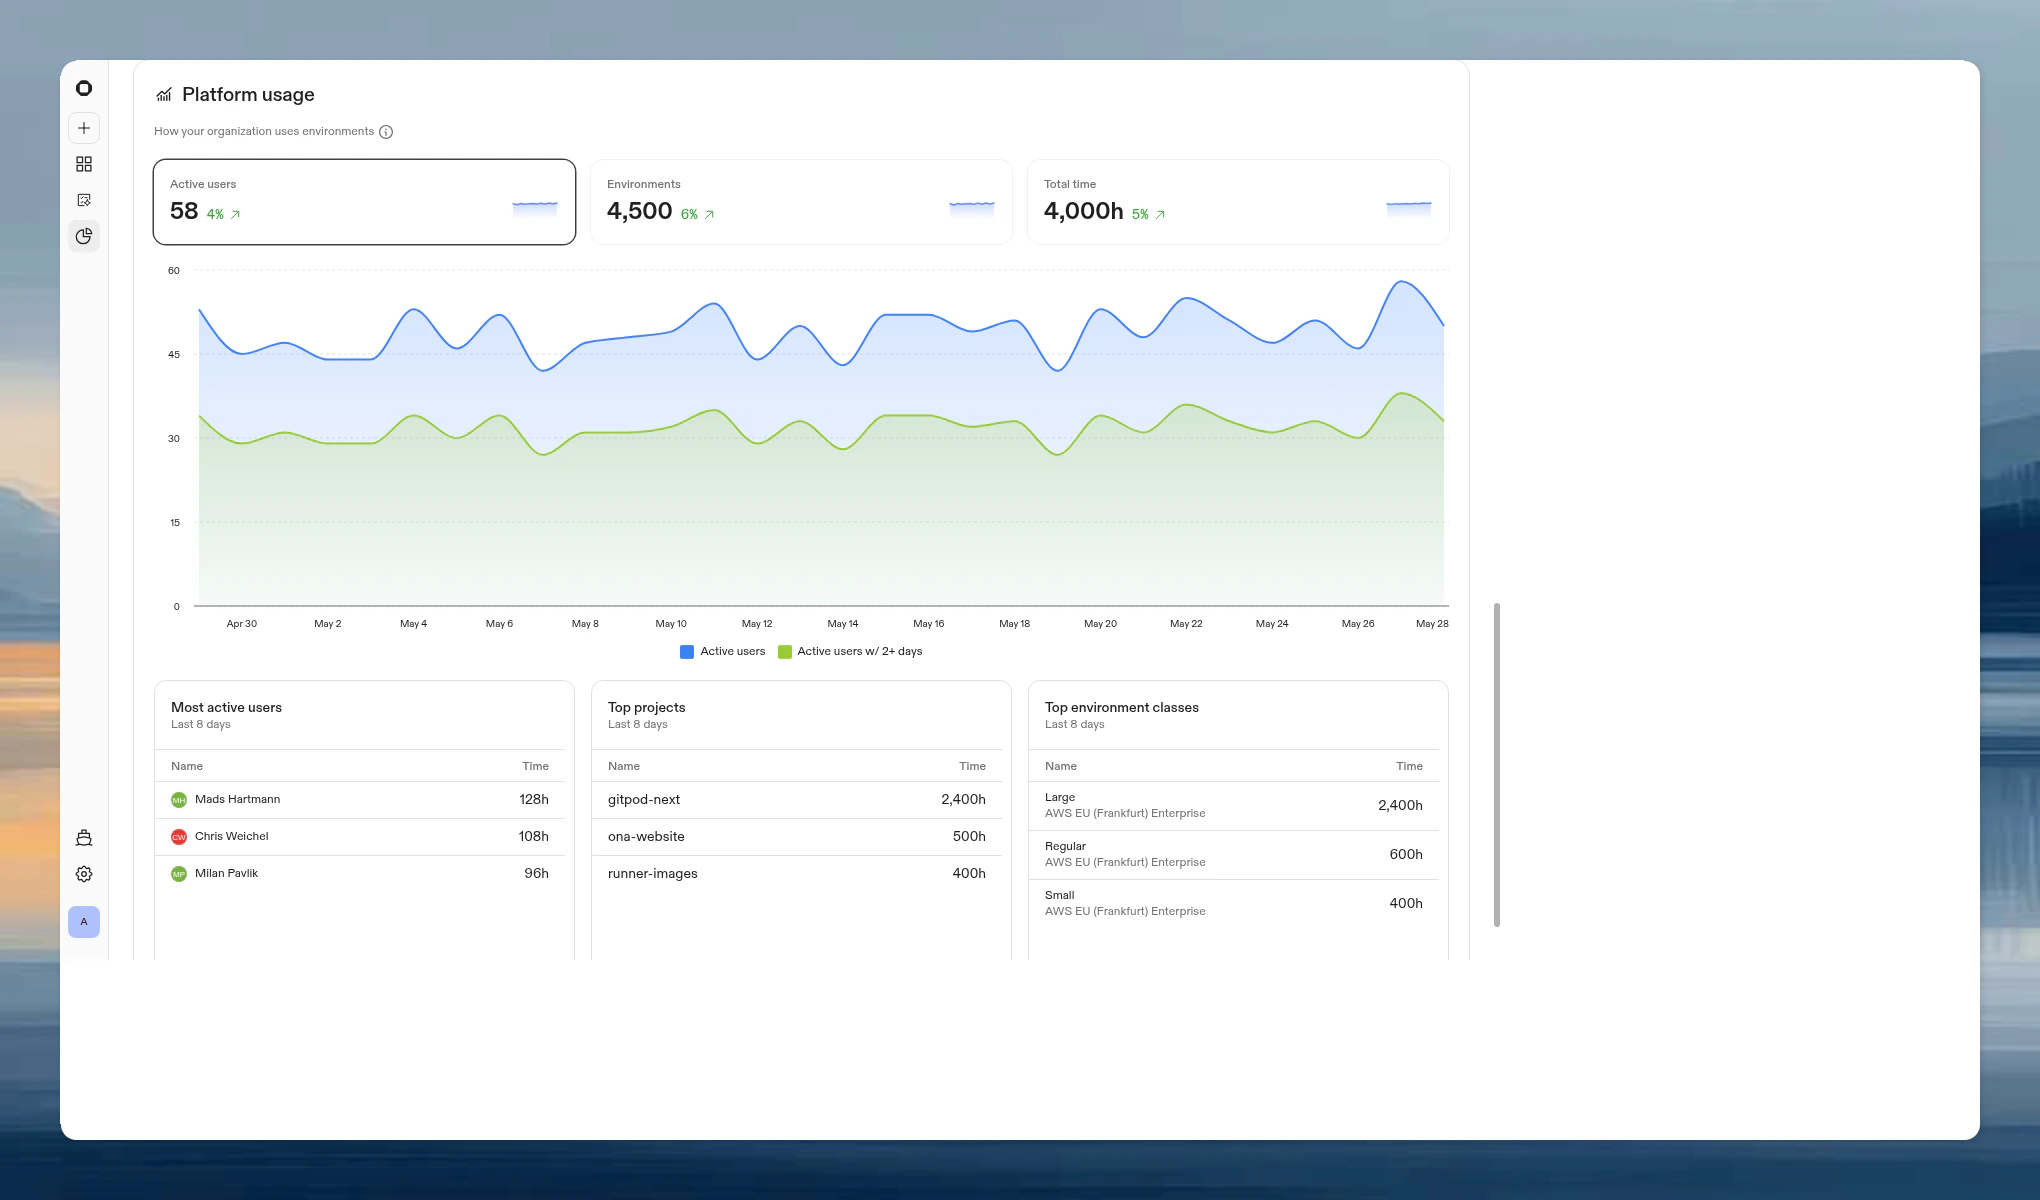
Metric cards
Click a metric card to view its time-series chart.
Detailed views
Below the chart, three tables show:API access
Query all Insights data programmatically with the Insights API for BI tooling, scheduled reports, or tracking AI adoption across teams.FAQ
Who can access Insights?
Who can access Insights?
Organization admins can view and manage Insights. Members with the Insights Viewer organization role can view Insights, but cannot enable project insights.
Does enabling insights for a project affect its environments?
Does enabling insights for a project affect its environments?
No. The daily analysis runs in a separate environment and does not interfere with developer workflows.
Which AI tools are detected?
Which AI tools are detected?
Ona, Codex, Claude, GitHub Copilot, and Cursor. Other AI co-authors are grouped under “Other AI”. Human co-authors (pair programming) are shown separately.
What counts as a deploy?
What counts as a deploy?
A PR merged to the project’s configured branch. If a project does not have a configured branch, it is excluded from the deploys metric.
Does this include deleted environments?
Does this include deleted environments?
Yes, platform usage data persists after environments are deleted.
Can I see data from before enabling insights?
Can I see data from before enabling insights?
Platform usage data is available from May 16, 2025 onwards regardless of when you enabled insights. Velocity and AI Adoption data starts from when you enable insights for each project.